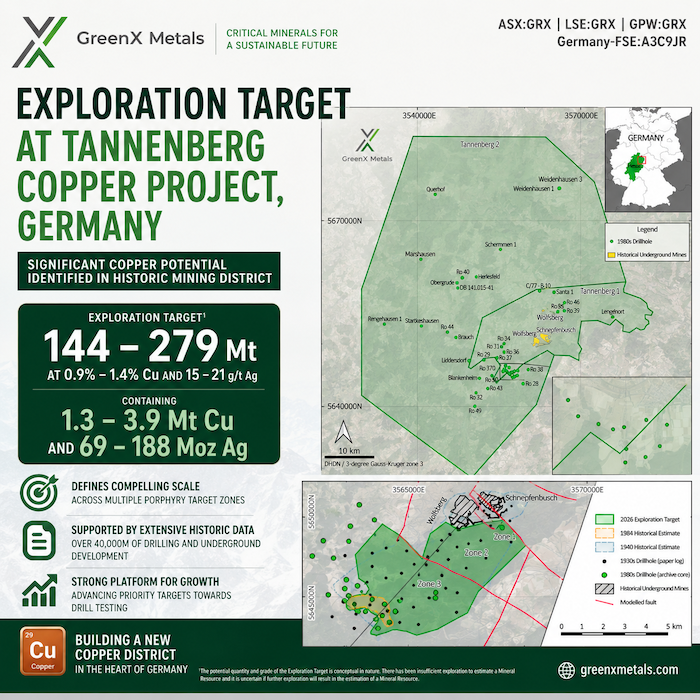
GreenX Metals Limited (ASX:GRX, LSE:GRX, GPW:GRX, Germany-FSE:A3C9JR) (GreenX or the Company) is pleased to announce an Exploration Target at the Tannenberg Copper Project (Tannenberg or the Project), in Germany. The estimated range of potential mineralisation in the Exploration Target is: 144 – 279 Mt at 0.9% – 1.4% Cu and 15 – 21 g/t Ag for 1.3 – 3.9 Mt Cu and 69 – 188 Moz Ag.
HIGHLIGHTS
· Exploration Target demonstrates potential for globally significant copper endowment at Tannenberg Copper Project, Germany.
· Exploration Target captures hanging wall and footwall mineralisation above and below the Kupferschiefer shale: a modern view of the deposit that the 1940 historical estimate did not contemplate.
· Validated by Kupferschiefer mining in Poland, where up to 95% of mineable copper at KGHM Polska Miedź S.A’s operations is hosted in the same footwall sandstone and hanging wall limestone units that host the Tannenberg Exploration Target.
· Built on validated historical foundations: Exploration Target builds on the 1940 National Socialist historical estimate area; the 1984 St Joe historical estimate; validation via resampling and logging of 1980’s core by GreenX and digitised archive material collected since August 2024.
· An inflection point for the Project: With the Exploration Target estimated, GreenX now transitions from archive synthesis to active exploration, including accessing historical underground mines for Scoping Study-level metallurgical test work, seismic survey evaluation and commencement of an initial drill program.
Cautionary Statement: The Exploration Target has been reported in accordance with the 2012 edition of the JORC Code (JORC Code). The potential quantity and grade of the Exploration Target is conceptual in nature. There has been insufficient exploration to estimate a Mineral Resource for the reported target areas. It is uncertain if further exploration will result in the estimation of a Mineral Resource.
|
Table 1: Exploration Target for Tannenberg |
|||||
|
Prospect |
Tonnes Range |
Cu Grade Range |
Ag Grade Range |
Contained Cu Range |
Contained Ag Range |
|
Zone 1 |
8 to 16 Mt |
0.9 to 1.4% Cu |
15 to 21 g/t Ag |
0.1 to 0.2 Mt Cu |
3.9 to 10.8 Moz Ag |
|
Zone 2 |
40 to 78 Mt |
0.4 to 1.1 Mt Cu |
19.3 to 52.7 Moz Ag |
||
|
Zone 3 |
96 to 186 Mt |
0.9 to 2.6 Mt Cu |
46.3 to 125.6 Moz Ag |
||
|
Total |
144 to 279 Mt |
1.3 to 3.9 Mt Cu |
69.4 to 188.4 Moz Ag |
||
GreenX’s Chief Executive Officer, Mr Ben Stoikovich, commented: “Today’s Exploration Target at Tannenberg is a result of 18 months of archive data search and synthesis. It also marks an inflection point where we transition from searching for archive data to ramping up our own exploration programs. The modern understanding of the Kupferschiefer system, demonstrated by the scale of Kupferschiefer mining operations in Poland today, shows that economic copper mineralisation extends well beyond the thin shale horizon that historical German exploration focused on. The size of the potential copper endowment at Tannenberg in Hessen, Germany, in the same geological formation of the world-class Polish deposits, justifies continued investment and exploration”.
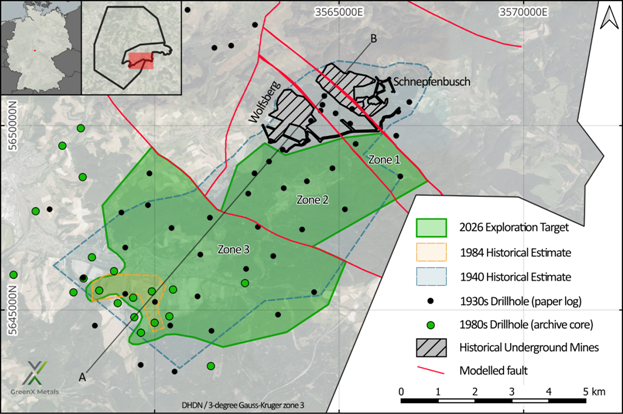
Figure 1: Outline of the Exploration target and its relationship to previous historical estimates and historical underground mining operations at Tannenberg. Section A-B is shown in Figure 4.
EXPLORATION TARGET
The Exploration Target provides a modern view of the copper potential at Tannenberg. Unlike the 1940 Historical Estimate, which assessed only the thin Kupferschiefer shale horizon (refer to announcement dated 20 October 2025), the Exploration Target captures mineralisation in the hanging wall above and footwall below the shale. This is consistent with the modern understanding of Kupferschiefer deposits as evidenced at KGHM Polska Miedź S.A’s (KGHM) mining operations in Poland. The sections below set out the historical foundations, the modern thickness model and the supporting work that underpin the Exploration Target.
Cautionary Statement: The Exploration Target has been reported in accordance with the JORC Code. The potential quantity and grade of the Exploration Target is conceptual in nature. There has been insufficient exploration to estimate a Mineral Resource for the reported target areas. It is uncertain if further exploration will result in the estimation of a Mineral Resource.
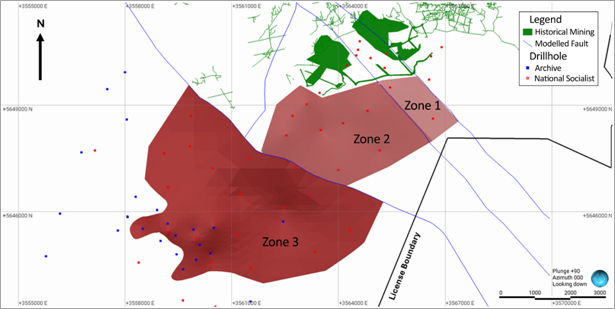
Figure 2: Top-down view of the Exploration Target wireframe at Tannenberg.
From historical mining district to Exploration Target
The Tannenberg Project has a long-documented history of drilling, mining, and estimation work, providing well-defined and historically validated copper-silver mineralisation that underpins today’s Exploration Target.
A 95-hole drilling campaign was completed by the National Socialist Government between 1935 and 1938 across the Richelsdorf Mining District. This dataset formed the geological basis for the construction of three Kupferschiefer copper mines within the Tannenberg licence area, Reichenberg, Wolfsberg and Schnepfenbusch. These mines operated between the late 1930’s and in some cases up to the mid 1950’s. GreenX has digitised and integrated this drillhole database into its geological models (refer to announcement dated 11 September 2025).
The 1940 historical estimate, produced by Mansfeldsche Kupferschieferbergbau AG (Mansfeld AG), is based on a spatially relevant subset of 18 holes from the 95-hole database and established 728,000 tonnes of contained copper* at an average grade of 2.6% copper (in the narrow Kupferschiefer shale only) between the Wolfsberg and Schnepfenbusch mines in the north and the Ronshausen area in the south (see Figure 1). The historical estimate covers mineralisation from a depth of 100 m in the north to 400 m in the southern end area near Ronshausen (refer to announcement dated 20 October 2025).
A later historical estimate from 1984 was produced by St Joe Explorations GmbH (St Joe), based on limited drilling between 1980 and 1984 (refer to announcements dated 2 August 2024 and 28 April 2025). The St Joe historical work estimated (20 October 2025) 169,000 tonnes of contained copper and 6.5 million ounces of contained silver within the small section of zone 3. St Joe assayed wider intersections and found that the mineralisation was up to 3.45 m thick. This is considerably thicker than the narrow Kupferschiefer shale assayed and estimated by Mansfeld AG in 1940. St Joe provided the first modern indication that economic mineralisation extends beyond the Kupferschiefer shale itself.
Cautionary statement for historical estimates: The historical estimates referenced in this announcement are not reported in accordance with the JORC Code. A competent person has not done sufficient work to classify the historical estimates as a mineral resource or ore reserve in accordance with the JORC Code. It is uncertain that following evaluation and/or further exploration work that the historical estimates will be able to be reported as a mineral resource or ore reserve in accordance with the JORC Code.
Modern thickness model
The modern understanding of the Kupferschiefer deposit model, as evidenced at KGHM’s Polish mining operations on the same geological setting as Tannenberg, shows that up to 95% of mineable copper can be hosted in the footwall sandstone and hanging wall limestone, with mineralisation often occurring up to 30 m above and 60 m below the Kupferschiefer shale horizon.
Applying the thick mineralisation concept to the historically defined Tannenberg footprint produces a statistically-derived mineralised thickness of 1.7 m – 3.3 m, compared with the 20 cm – 60 cm (shale-only) thickness used in the 1940 historical estimate. The 1.7 m – 3.3 m thickness is consistent with the wider intercepts confirmed by St Joe in the 1980s and has now been independently validated by GreenX’s resampling of available archived core.
COMPLETION OF ARCHIVE CORE logging and sampling
After relogging a total of 4,389 m of archived core and taking 2,368 new samples, GreenX has now brought its work on the archived core to a close. This program was initiated after the discovery that drill core had been retained in the archives of the Hessisches Landesamt für Naturschutz, Umwelt und Geologie (HLNUG) for over 40 years since drilling. This new logging and sampling has been conducted in accordance with industry standard practices and has facilitated the estimation of the Exploration Target ranges. In addition to the validation of the historical copper and silver grades around the historical mining areas (see announcement date 20 November 2025), the data has demonstrated that the copper and silver mineralisation persists many kilometres away from the historical copper mines (Wolfsberg, Schnepfenbusch, and Reichenberg).
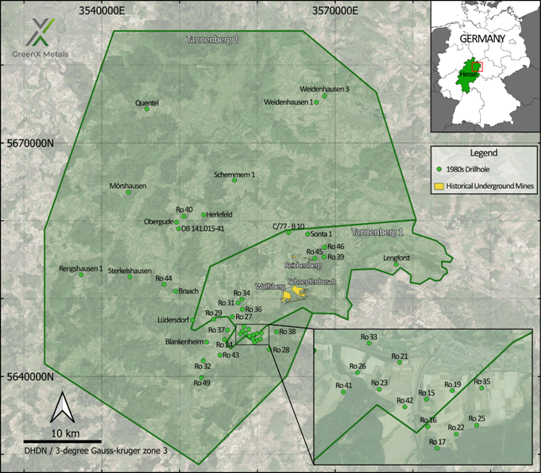
Figure 3: Location map of 1980s Archive drillholes recently logged and assayed by GreenX.
Upcoming and ONGOING Work Programs
GreenX is advancing a coordinated suite of exploration activities which will test the validity of the Exploration Target identified at Tannenberg, including:
· Mineralogical and desktop metallurgical analysis of material collected from archive core – Q2 2026;
· Accessing historical underground mines for scoping study-level metallurgical test work, chip sampling, as well as mapping and surveying for 3D modelling – 2H 2026;
· Collation and digitisation of historical geological, mine development, and production data – ongoing;
· Analysis of the use of seismic surveys to aid future drilling campaigns including collecting petrophysical measurements for seismic forward modelling – Q2 2026;
· Seismic survey, if appropriate – commencement H2 2026; and
· Initial drill program – commencement late 2026.
Exploration target: Drillhole database audit and verification
GreenX logged, sampled, and assayed available archive core at Tannenberg (Archive). The work was done by Palsatech in a specialist logging facility in Sweden. MSA Mining Consulting UK Ltd’s (MSA-UK) independent competent person visited the facility while Archive core was being processed. All intercepts with significant Cu-Ag mineralisation were drilled by St Joe’s during their 1980s exploration drilling.
The 1930s National Socialist drillhole database was compiled by GreenX geologists, transcribed from hard copy, historical records. An independent audit and verification of the data against these records was not undertaken by MSA-UK. Given that the intention is to declare an Exploration Target, this is not considered a material risk by MSA-UK.
Data validation was undertaken during the import routine in the form of correcting issues such as from/to errors and preparing the data in a format that can readily be imported into three-dimensional modelling software.
Exploration target: Geological Modelling
A geological model was constructed in Leapfrog Geo. Although a number of mapped faults cross the area, only five, relevant fault structures were considered in the model (Figure 1). Four stratigraphic units, namely the Basement, Rotliegend, Zechstein and Buntsandstein were modelled. Due its narrowness and the lateral scale of the model, which spans several kilometres, the Kupferschiefer layer was modelled only as the contact between the Rotliegend and Zechstein. Displacement by faulting is data driven, where the relative position of the stratigraphic units on either side of the fault determines the vertical displacement (Figure 4).
A conceptual mineralisation model was constructed from the drillhole data using a threshold value of 0.30 % Cu. This value was based on the log-probability plot for the combined dataset (Figure 5), which shows a break in the grade population around this threshold. This is a reasonable value, as it incorporates mineralisation in the footwall Rotliegend, the Kupferschiefer and the hanging wall Zechstein.
In addition to the grade threshold, a minimum thickness of 1.5 m was applied during the modelling process, based on regulation and practise at copper mines in Poland Where necessary, low-grade samples falling below the threshold were incorporated into the mineralised zone to achieve the minimum thickness, provided the full composite grade satisfied the threshold value. Due to the sampling bias in the National Socialist dataset, only data generated from 1980s era drilling was used to constrain the thickness of the mineralisation model.
However, the National Socialist data was used to infer lateral continuity of the mineralisation. In order to not overstate tonnages, the mineralisation was truncated against the modelled faults, extrapolated no more than 500 metres beyond the data and limited within the Tannenberg license boundary. Furthermore, mined out areas where discounted from the mineralisation model.
Three areas were considered, a larger area to the southwest, Zone 3, where the model is informed by a combination of Archive and National Socialist data and two smaller areas across fault boundaries towards the northeast, Zone 1 and Zone 2, as shown in Figures 1 and 2.
Zone 3 has an areal extent of approximately 6 km by 3.5 km. The mineralisation thins out towards the southwest and northwest where drillholes tend to have low-grade copper intercepts that do not meet the minimum thickness criteria, therefore being excluded from the model. Towards the northeast, the mineralisation terminates against a northwest-southeast running fault. Zone 2 is located adjacent to Zone 3 on the northeast side of the bounding fault, with an extent of 3.1 km in the northwest to southeast direction and 2.8 km in the northeast direction. Zone 1 is narrow, bound by two parallel faults and has an areal extent of 1.8 km by 900 m. Both Zones 1 and 2 have been restricted in extent from known mined out areas to the north.
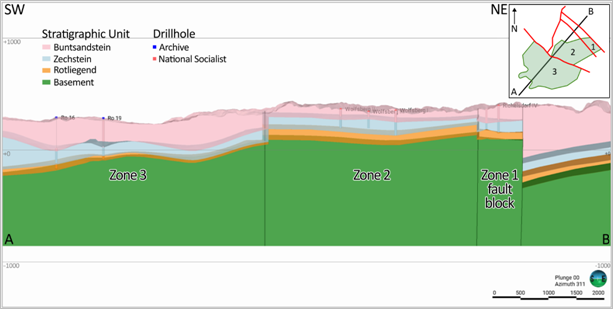
Figure 4: Pseudo 3D cross section of modelled stratigraphic units and zones of the Exploration Target estimate. Section (A-B) is also shown in Figure 1. Modified from MSA-UK.
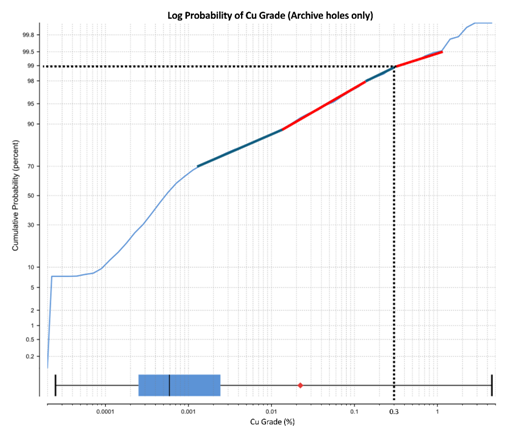
Figure 5: Log probability plot of the copper grades from Archive database. Modified from MSA-UK
Exploration target: GRADE AND THICKNESS ESTIMATION
As per the requirements for declaring an Exploration Target, grade and tonnages need to be expressed in ranges. The lateral extent of the mineralised zones is restricted by structural features and the license boundary, with little room for extrapolation. Therefore, tonnage ranges are given by assuming a variable thickness of the mineralised zones, which is supported by the dataset. Only the Archive data was used to derive grade and thickness ranges as it provides a complete vertical profile through the mineralised zone. Samples captured within the Zone 3 mineralised area were selected and composited to full thickness, resulting in ten composite samples. Full thickness composites were used to derive both grade and thickness ranges for the Exploration Target because this approach minimises the variability of the smaller sample intervals, thus reducing sampling bias and avoiding artificially inflated grades when estimating grade ranges. An additional drillhole, Ro 45, located to the north outside of the area of interest was also used to supplement the data. This hole was included as it is the only Archive drillhole outside of the modelled area that meets the minimum criteria and was incorporated to support the statistical analysis given the limited number of available data points. The remaining Archive holes were not considered as they fall outside the modelled extents of the mineralisation.
The list of drillholes, copper and silver grades and accumulated grades are shown in Table 2 below.
|
Table 2: List of full thickness composites for grade and thickness estimation |
|||||||
|
Hole ID |
From |
To |
Thickness (m) |
Cu (%) |
Ag (g/t) |
Accumulated Copper Grade Cu % per metre |
Accumulated Silver Grade Ag g/t per metre |
|
Ro 15 |
285.6 |
289.3 |
3.7 |
1.19 |
16.6 |
4.41 |
61.5 |
|
Ro 17 |
481.25 |
483 |
1.75 |
0.89 |
18.2 |
1.56 |
31.9 |
|
Ro 18 |
209 |
210.76 |
1.76 |
3.00 |
28.7 |
5.28 |
50.6 |
|
Ro 19 |
339 |
342 |
3 |
1.38 |
16.2 |
4.13 |
48.5 |
|
Ro 20 |
377 |
378.68 |
1.68 |
1.33 |
14.6 |
2.24 |
24.5 |
|
Ro 22 |
435.76 |
439.4 |
3.64 |
0.94 |
16.0 |
3.43 |
58.1 |
|
Ro 23 |
366 |
367.5 |
1.5 |
2.69 |
55.3 |
4.04 |
83.0 |
|
Ro 25 |
533.38 |
534.89 |
1.51 |
1.32 |
27.9 |
2.00 |
42.2 |
|
Ro 35 |
379.15 |
381 |
1.85 |
0.35 |
10.5 |
0.65 |
19.5 |
|
Ro 38 |
536.25 |
539.5 |
3.25 |
0.56 |
11.4 |
1.83 |
37.2 |
|
Ro 45 |
268.34 |
270.37 |
2.03 |
1.62 |
20.5 |
3.29 |
41.7 |
|
Source: MSA-UK |
|||||||
Statistics were derived for the length-weighted copper and silver grades and composite sample lengths as shown in Table 3.
|
Table 3: Summary statistics of mineralised drillhole composites |
|||||||
|
Variable |
Minimum |
Maximum |
Mean |
Median |
Lower Quartile |
Upper Quartile |
Coefficient of Variation |
|
Thickness (m) |
1.50 |
3.70 |
2.33 |
3.00 |
1.68 |
3.25 |
0.37 |
|
Cu grade (%) |
0.35 |
3.00 |
1.28 |
1.19 |
0.89 |
1.38 |
0.63 |
|
Ag grade (g/t) |
10.5 |
55.3 |
19.4 |
16.2 |
14.6 |
20.5 |
0.65 |
|
Source: MSA-UK |
|||||||
An attempt was made to derive grade and thickness ranges using a two-sided confidence interval method on the dataset however this statistical approach resulted in very narrow ranges which are not representative of the inherent variability of the data. Therefore, the interquartile range (IQR) was used instead to define the lower and upper grade and thickness ranges. In this case, the IQR is considered appropriate for this small dataset, as it provides a measure of dispersion around the median, thus reducing the influence of grade and thickness outliers. The resultant ranges are therefore a more realistic representation of the dataset (Table 4).
|
Table 4: Exploration Target lower and upper ranges for grade and thickness |
||
|
Variable |
Lower Range |
Upper Range |
|
Thickness (m) |
1.7 |
3.3 |
|
Cu (%) |
0.9 |
1.4 |
|
Ag (g/t) |
15 |
21 |
|
Source: MSA-UK Note: Grade and thickness ranges rounded to one decimal place to reflect this is an estimate |
||
Density data is not currently available for the project, therefore average densities were sourced from available literature (Taylor, R.D and Anderson, E.D., 2010). An assumption was made for a three metre thick mineable width with the Kupferschiefer shale representing 0.40 m of the total thickness, while the Zechstein and Rotliegend have assumed thicknesses of 1.30 m. Average densities were assigned as shown in Table 5.
|
Table 5: Assumed average densities per stratigraphic unit |
|||
|
Stratigraphic Unit |
Rock Type |
Thickness (m) |
Density (t/m3) |
|
Zechstein |
Limestone |
1.30 |
2.75 |
|
Kupferschiefer |
Shale |
0.40 |
2.40 |
|
Rotliegend |
Sandstone |
1.30 |
2.55 |
|
Source: Taylor, R.D and Anderson, E.D., 2010 |
|||
A weighted, average relative density for the three-metre-thick mineralised zone is calculated as 2.62 t/m3.
Exploration target: ESTIMATION
According to the JORC Code, an Exploration Target is “a statement or estimate of the exploration potential of a mineral deposit in a defined geological setting where the statement or estimate, quoted as a range of tonnes and a range of grade (or quality), relates to mineralisation for which there has been insufficient exploration to estimate a Mineral Resource”. The code states that the terms “Resource” and “Reserves” must not be used in this context to refer to the potential quantity and grade of the target.
The base case for the mineralisation is based on the areal extent of copper mineralisation, above a threshold of 0.30 % Cu, that meets a minimum thickness criteria of 1.50 m. Surfaces created in Leapfrog Geo were used to model lateral continuity of the mineralised zones and derive areas for three zones. Thickness ranges were derived from the Archive data and using an assumed average density of 2.62 t/m3, lower and upper ranges of tonnages were calculated as shown in Table 6.
|
Table 6: Tonnage ranges for each zone |
||||||
|
Zone |
Area (m2) |
Thickness (m) |
Density (t/m3) |
Tonnage (Mt) |
||
|
Lower |
Upper |
Lower |
Upper |
|||
|
Zone 1 |
1,800,000 |
1.7 |
3.3 |
2.62 |
8 |
16 |
|
Zone 2 |
9,000,000 |
40 |
78 |
|||
|
Zone 3 |
21,500,000 |
96 |
186 |
|||
|
Total |
43,000,000 |
144 |
279 |
|||
|
Source: MSA-UK. Note: m2 = square metres; m = metres; t/m3 = tonnes per cubed metre; Mt = Million Tonnes Areas are rounded to the nearest 100,000 m2 to reflect this is an estimate Tonnages are rounded to the nearest 1,000,000 tonne to reflect this is an estimate Grade and thickness ranges rounded to one decimal place to reflect this is an estimate |
||||||
Full thickness composite grade data was used to derive grade ranges for copper, with the estimated contained copper ranges shown in Table 7.
|
Table 7: Copper grade and contained metal ranges for each Zone |
||||||
|
Zone |
Tonnage (Mt) |
Cu Grade (%) |
Contained Cu (Mt) |
|||
|
Lower |
Upper |
Lower |
Upper |
Lower |
Upper |
|
|
Zone 1 |
8 |
16 |
0.9 |
1.4 |
0.1 |
0.2 |
|
Zone 2 |
40 |
78 |
0.4 |
1.1 |
||
|
Zone 3 |
96 |
186 |
0.9 |
2.6 |
||
|
Total |
144 |
279 |
1.3 |
3.9 |
||
|
Source: MSA-UK Note: Mt = Million Tonnes. Tonnages are rounded to the nearest 1,000,000 tonne to reflect this is an estimate Grade and thickness ranges rounded to one decimal place to reflect this is an estimate |
||||||
Similarly, silver grade ranges were used to derive contained silver lower and upper scenarios for each zone as shown in Table 8.
|
Table 8: Silver grade and contained metal ranges for each Zone |
||||||
|
Zone |
Tonnage (Mt) |
Ag Grade (g/t) |
Contained Ag (Moz) |
|||
|
Lower |
Upper |
Lower |
Upper |
Lower |
Upper |
|
|
Zone 1 |
8 |
16 |
15 |
21 |
3.9 |
10.8 |
|
Zone 2 |
40 |
78 |
19.3 |
52.7 |
||
|
Zone 3 |
96 |
186 |
46.3 |
125.6 |
||
|
Total |
144 |
279 |
69.4 |
188.4 |
||
|
Source: MSA-UK Note: Mt = Million Tonnes; Moz – million troy ounces g/t – gram per metric tonne; Tonnages are rounded to the nearest 1,000,000 tonne to reflect this is an estimate Ounces are rounded to the nearest 100,000 troy ounce to reflect this is an estimate Grade and thickness ranges rounded to one decimal place to reflect this is an estimate 1 troy ounce (oz) = 31.1034768 grams |
||||||
The Exploration Target for the combined Tannenberg mineralisation is shown in Table 9. As per the JORC Code, it must be stated that the potential quantity and grade of the Exploration Targets are conceptual in nature, that there has been insufficient exploration to estimate Mineral Resources and that it is uncertain if further exploration will result in the estimation of Mineral Resources.
|
Table 9: Tannenberg Combined Exploration Target |
|||||||||
|
Tonnages (Mt) |
Cu (%) |
Ag (g/t) |
Contained Cu (Mt) |
Contained Ag (Moz) |
|||||
|
Lower |
Upper |
Lower |
Upper |
Lower |
Upper |
Lower |
Upper |
Lower |
Upper |
|
144 |
279 |
0.9 |
1.4 |
15 |
21 |
1.3 |
3.9 |
69.4 |
188.4 |
|
Source: MSA-UK. Note: Mt = Million Tonnes; Moz – million troy ounces; g/t – gram per metric tonne; Tonnages are rounded to the nearest 1,000,000 tonne to reflect this is an estimate Contained copper and silver ounces are rounded to the nearest 100,000 troy ounce to reflect this is an estimate Grade and thickness ranges rounded to one decimal place to reflect this is an estimate 1 troy ounce (oz) = 31.1034768 grams |
|||||||||
INCENTIVE SECURITIES
In order to incentivise management and align their interests with shareholders, the Company will issue incentive options which will only vest if the following project milestone at Tannenberg is achieved:
· Class C: the public announcement by GreenX of an independently assessed JORC Code inferred resource of at least 1,500,000 tonnes of contained copper equivalent at a minimum resource grade of 1% Cu Equivalent** (or equivalent, with a cut-off grade of 0.3% Cu equivalent).
|
Holder |
Class C |
|
Mr Benjamin Stoikovich (subject to shareholder approval) |
1,500,000 |
|
Mr Mark Pearce (subject to shareholder approval) |
600,000 |
|
Other key employees and consultants (to be issued under the Company’s shareholder approved equity incentive plan) |
5,600,000 |
**Cu Equivalent means any combination of Cu, Ag, Ni, Co, Cr, Pt, Pd, Au, Rh, Ru, Ir, Os, Zn and/or Pb.
ENQUIRIES
|
Ben Stoikovich Chief Executive Officer |
Kazimierz Chojna Investor Relations – Poland
|
|
+44 207 478 3900 ir@greenxmetals.com |
Kim Eckhof Investor Relations – UK/Germany |